New data reveals that there is just one electric vehicle charger for every ten miles in England’s county and rural areas
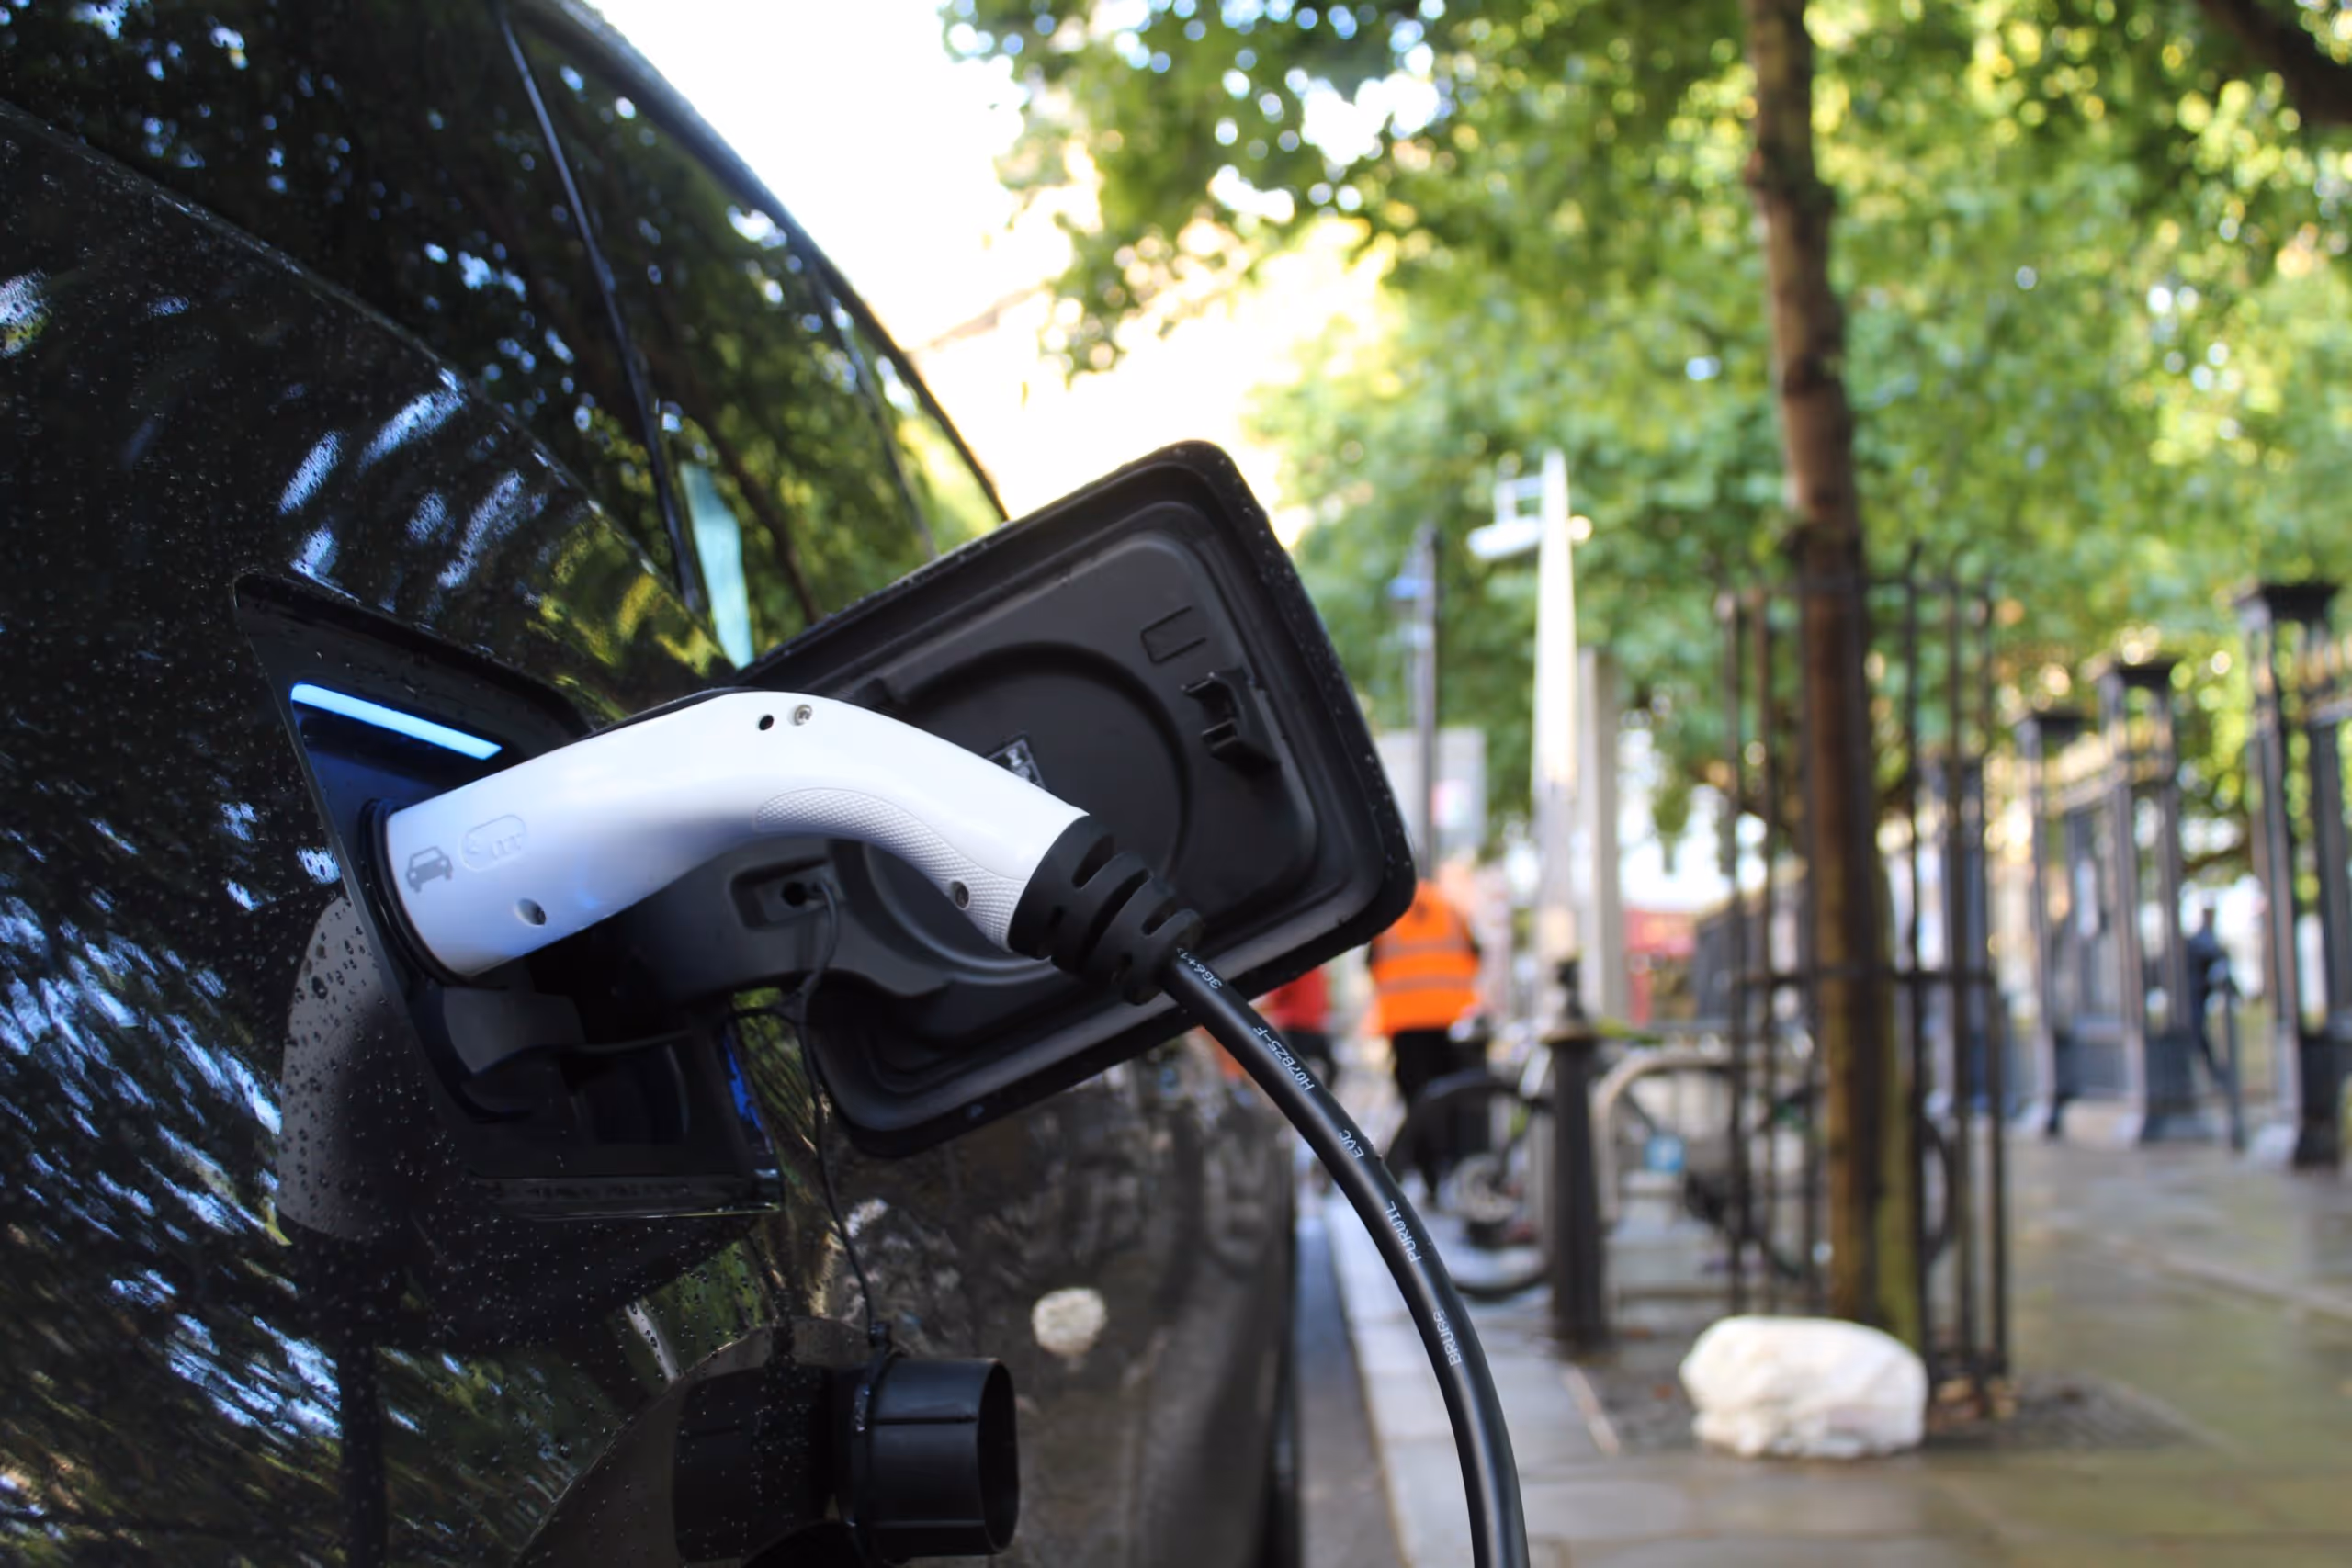

A new report has found that the number of publicly-available electric vehicle charge points in England’s county and rural areas lags far behind major towns and cities – as councils warn that much more needs to be done to close the gap in order to meet demand.
With the number of electric vehicles on England’s roads topping one million this year, analysis from the County Councils Network (CCN) finds that drivers in 38 county areas are at a significant disadvantage compared to urban motorists, with just one publicly available chargepoint for every ten miles in these locations, compared to one for every three-quarters of a mile in London and one for every 4.5 miles in the country’s major cities and towns.
Following the Prime Minister’s announcement last week to delay the ban on petrol and diesel vehicles until 2035, the CCN is calling on this government and the next administration to prioritise investment into county areas to help them close the gap between rural and urban areas, otherwise it will be much harder for drivers in their areas to switch.
Just 2% of vehicles registered in county areas as of March this year were plug-in electrical vehicles – the lowest ratio in the whole of England.
Download the report Electric vehicle infrastructure: analysing the challenge in powering England’s plug-in revolution, here.
New analysis in the CCN’s reportfinds that:
- The number of plug-in vehicles being registered in county areas has risen dramatically over the last five years, from 70,337 in 2019 to 385,761 as of March 2023. However, with over 18m vehicles on the road in county areas, this represents just 2.1% of the total registered vehicles in those areas. This is significantly less than London (4.6%), especially inner London (7%) and metropolitan borough areas (3.7%). Just 35% of electric vehicle registrations are in county areas, despite them being home to half of England’s population.
- Despite this increase in electric vehicles on the road, the report finds that publicly-available chargepoints have not caught up in county areas. As of July, councils in those locations have delivered over 5,500 extra chargers, with partners, in the last two years, but there is still only one charger for every 9.5 miles in England’s county areas on average – significantly worse than London average (one charger for every 0.7 miles), inner London (one charger for every 0.3 miles), England’s 25 biggest cities (one charger for every 3.7 miles) and metropolitan borough areas (one charger for every 4.5 miles).
- This ratio is holding back drivers in county areas switching to electric vehicles, the report argues. There are just over 13,500 publicly-available chargers in county areas, with London having almost the same amount (13,300) despite its population being significantly smaller to England’s 38 counties. Those county areas have 70% of England’s road miles.
The government has committed to rolling out 300,000 public chargers across the UK by 2030, but with only 37,717 built in England as of July this year, the report warns that this government and the next administration must ensure that councils can dramatically ramp up delivery over the next seven years.
CCN argues that urban areas, particularly London and the major cities, have been able to dramatically ramp up electric vehicle infrastructure because government resource and policy has been focused on those areas.
This month, the government announced funding allocations for its Local Electric Vehicle Infrastructure Fund, which totals £450m with every county area set to receive funds.
But councils warn they will likely need further rounds of funding in the coming years to roll out a comphrensive network of chargers, with many facing significant financial pressures and unable to undertake significant investment themselves to ensure there are enough chargers locally.
Therefore, the CCN is calling on the next government to keep the total amount of funding for chargers under review, and to distribute any future funding based on need, rather than through competitive bidding.
This must be proportionate to the scale of the challenge in county areas, with data showing that between 2005 and 2020 carbon emissions fell in England’s counties by 30%, a slower rate than any other part of the country, with transport the biggest source of emissions.

Cllr Sam Corcoran, Climate Change Spokesperson for the County Councils Network, said:
“Considering where we were only five years ago, the increase number of electric vehicles on England’s roads is a significant achievement. But if we are to continue this progress – and we must in order to reach net zero – then there needs to be enough infrastructure to encourage and enable drivers to make the switch.
“As this analysis shows, whilst huge improvements have been made, much more needs to be done in county areas. Councils in county areas have delivered over 5,500 chargers over the last two years, in tandem with private providers but the availability of publicly-available chargers lags behind the cities and urban areas. With only one charger for every ten miles on average in England’s counties.
“The major cities an urban areas have seen the bulk of government’s policy focus and funding on climate action so far, and as a result emissions in those places have fallen at a faster rate than rural areas. Whilst the government’s final allocation of LEVI funds did provide a significant boost to county areas, it is unlikely to be enough. Therefore, the next government must ensure there are substantial funds available for electric vehicle infrastructure, and this must continue to be prioritised to county areas, based on the scale of the emissions reduction challenge they face.”
Number of publicly-available chargepoints across England, and number of electrical vehicles registered
| Council type/area | Publicly-available charge points – July 2023 | Ratio of chargers to miles | Number of electrical vehicles registered – Q1 2023 | Proportion of electrical vehicles as a percentage of all vehicles |
| London | 13,371 | 0.7 miles per chargepoint | 139,006 | 4.6% |
| Metropolitan Boroughs | 5,720 | 4.5 miles per chargepoint | 236,957 | 3.7% |
| Core and Key Cities | 5,157 | 3.7 miles per chargepoint | 134,783 | 3% |
| Non-county unitary | 5,084 | 4.5 miles per chagepoint | 326,458 | 5.3% |
| County and rural areas (CCN) | 13,542 | 9.5 miles per chargepoint | 385,761 | 2.1% |
| England | 37,717 | 5 miles per chargepoint | 1,105,169 | 3.3% |
.avif)
.avif)